03 — Research Software / Visualization
HARP Research
Making abstract mathematical structures usable: Python representations, tested abstractions, graph operations, and visual tools for generalized graph research.
Research work spanning representation, API design, unit testing, multilayer graph modeling, visualization, and an exploratory Qiskit proof of concept.
Research problem
Structure before visualization.
HARP’s work involved generalized graphs and hypergraphs with richer relationships than a conventional node-and-edge diagram. Vertices, edges, layers, direction, spin, and interactions all needed software representations before they could become a useful visual system.
My contribution went beyond drawing graphs. I worked on the Python structures and operations that let researchers create, manipulate, test, and then visualize those ideas in HarpGraph2. The challenge was to understand an unfamiliar mathematical domain well enough to turn its rules into dependable software behavior.
Research-to-software flow
Abstract theory, made workable.
- 01Research concept
Understand the mathematical entities and relationships under study.
- 02Representation
Define Python objects that preserve the required mathematical structure.
- 03Tested API
Validate operations, equivalence handling, and expected exceptions with pytest.
- 04Graph model
Support node insertion, connectivity, layers, direction, and notation.
- 05Integration
Bring quaternion-related structures into the broader HarpGraph2 work.
- 06Visualization
Turn the model into a diagram researchers can inspect and reason about.
HurwitzQuaternion
A mathematical idea as a Python API.
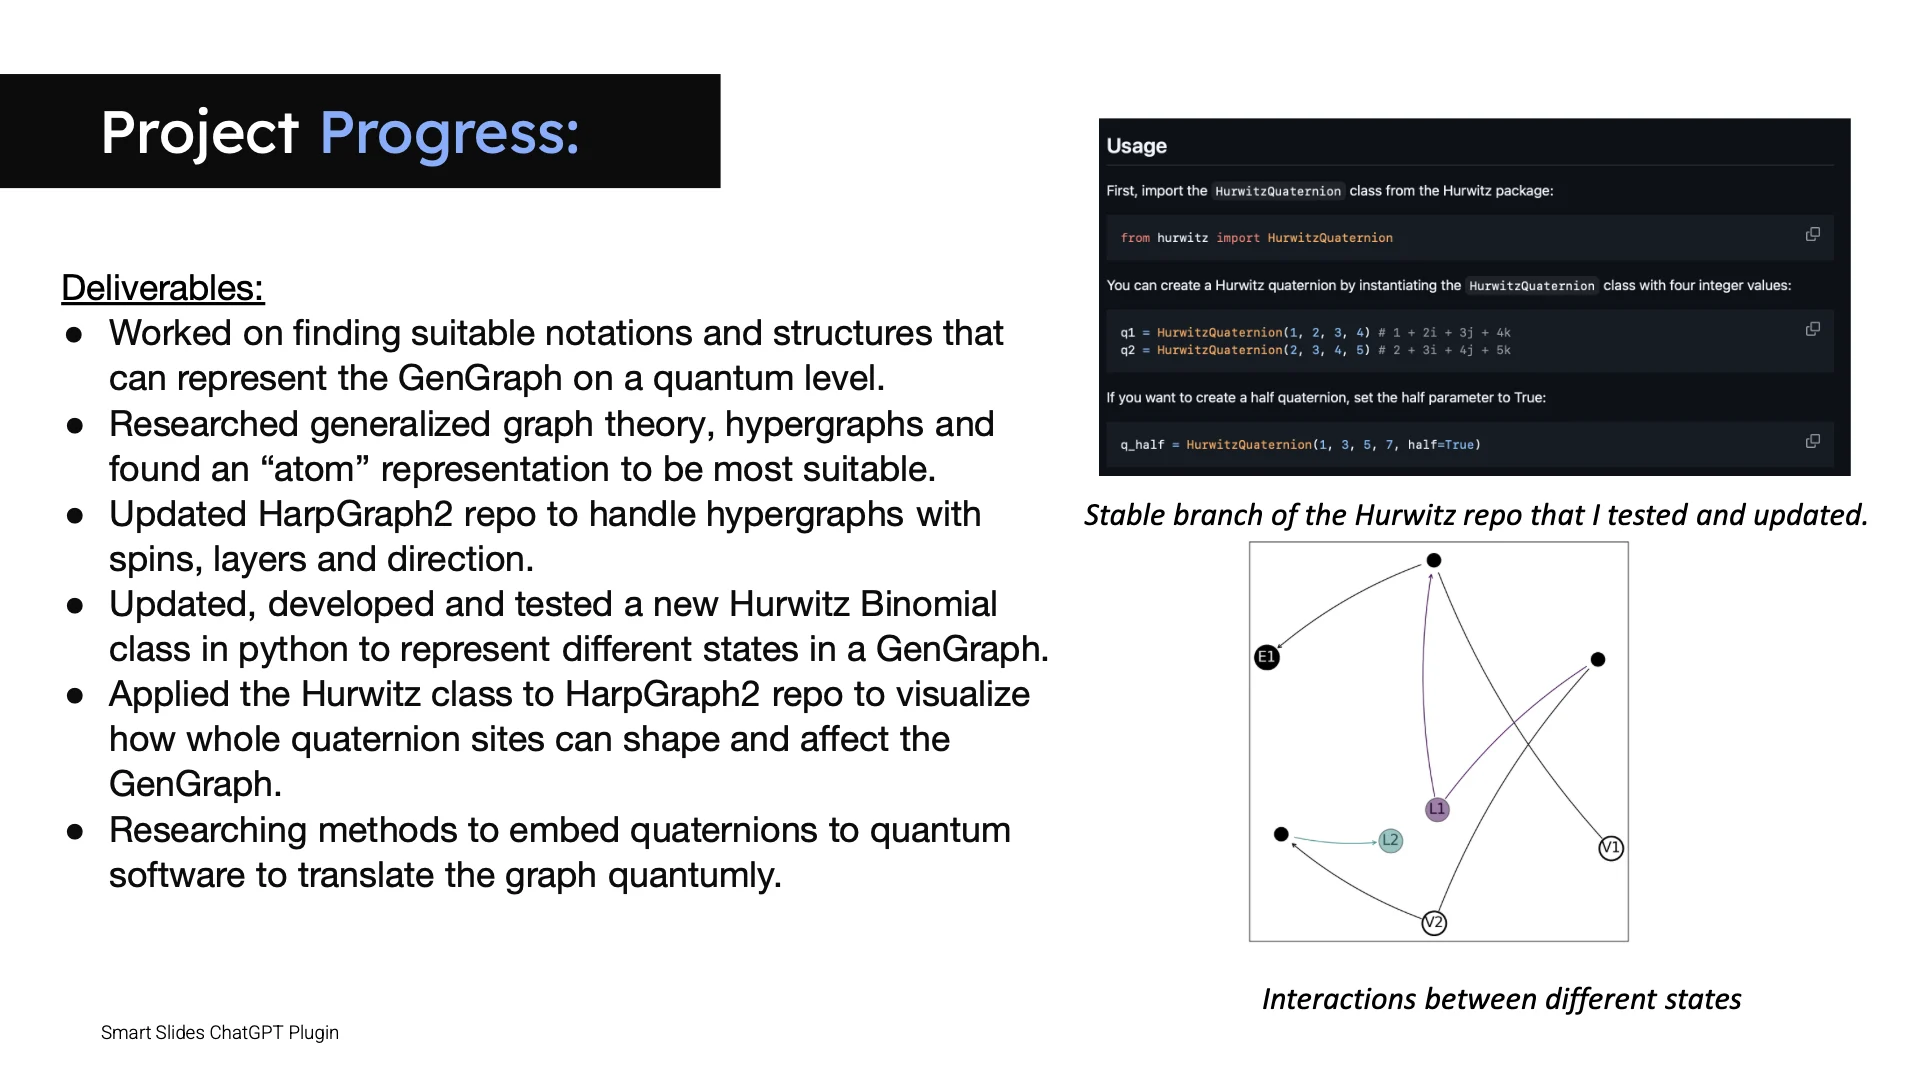
I developed an object-oriented Python API for Hurwitz quaternion integers with more than 15 core operations. The work included Euclidean division, conjugation, equivalence handling, and unit tests for both correct results and exception behavior.
Whole-integer and half-integer forms needed explicit representation. The supplied project material shows the constructor below as the public interface for creating both forms:
from hurwitz import HurwitzQuaternion

q1 = HurwitzQuaternion(1, 2, 3, 4)
# 1 + 2i + 3j + 4k

q_half = HurwitzQuaternion(
    1, 3, 5, 7, half=True
)
Why the tests mattered
In research software, a plausible-looking result is not enough. pytest coverage helped capture mathematical expectations as executable checks, including edge cases and invalid operations, so later graph work could rely on a stable abstraction.
HarpGraph2
From graph operations to an intelligible model.
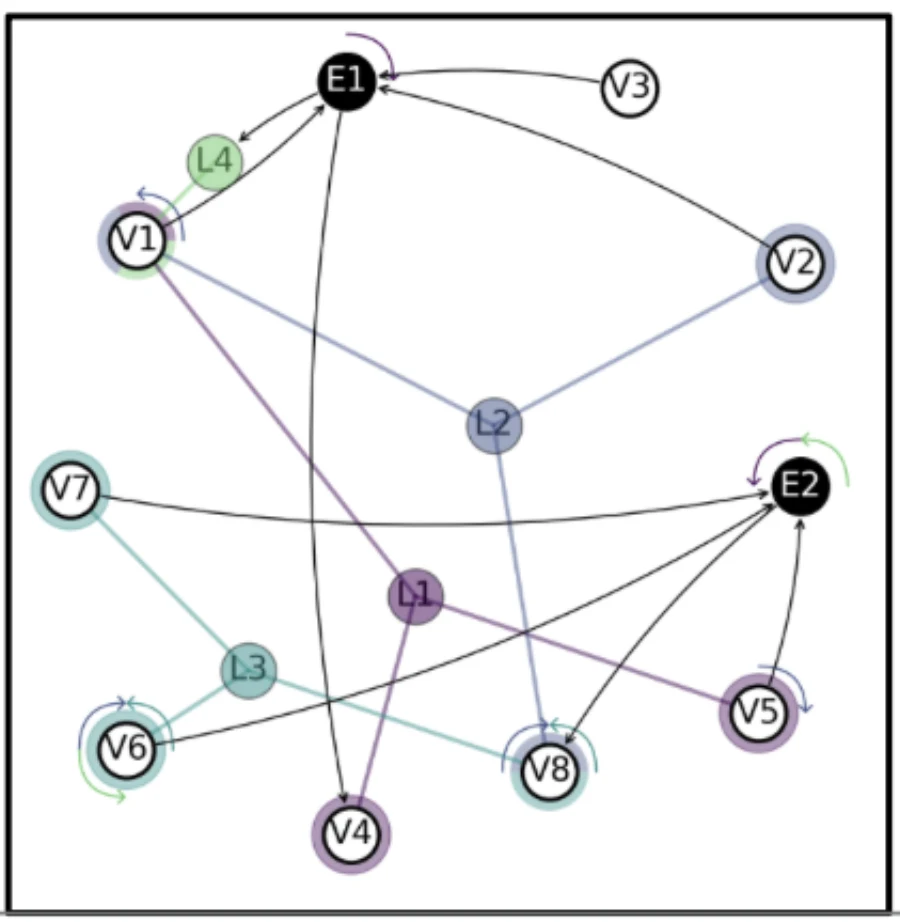
I implemented more than 50 graph operations and three notation systems supporting node insertion, connectivity, and multilayer graph modeling. HarpGraph2 was updated to better represent spins, layers, and direction, then used to expose the structure visually.
Visualization
A tool for reasoning, not decoration.
The interface work used Python and Matplotlib to make complex graph data visible for research prototyping and validation. The completed GenGraph differentiates vertices, edges, layers, directional relationships, and spins so the output remains connected to the underlying model.
The work also included a Qiskit proof of concept exploring whether classical graph structures could be embedded into quantum circuits. That was an exploratory feasibility step within the broader research—not the central purpose of the project.
What the work demonstrates
Entering an abstract domain and making it concrete.
This project required learning the vocabulary and rules of a specialized research area, separating the mathematical model from its software representation, building testable abstractions, and connecting those abstractions to tools researchers could inspect.
The result was not simply a graph image. It was a path from theory to structured Python software to a model that could be manipulated, validated, and understood visually.